
In Grinold & Kahn's Active Portfolio Management they use the distribution of the Magellan Fund's monthly returns and show that a normal assumption is a reasonable approximation for the distribution of these returns. From that we are taken through the use of standard deviation, variance, etc., and further into the use of tracking error at a portfolio level as a measure of active risk.
Using this as a starting point I took 60 months of returns of the Magellan Fund (I picked 60 as this is the standard period selected by most long term risk models) as of the data in the book ending on September 1994, and compared it with the same dataset generated as of the end of June 2009.
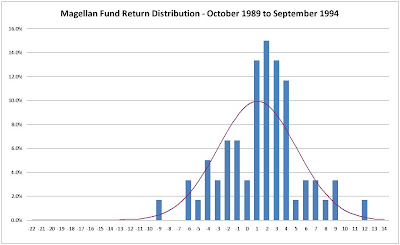
This is the 1994 data displayed graphically, and while we can see some negative skew to the chart and some small kurtosis around the mean, one can see how the normal distribution is a fair estimate for the distribution of the returns. As a check, we can go back to standard statistics when checking for the normality assumption, namely the mean, median, standard deviation, skew, and kurtosis.
The statistical table for the 1994 data vs. today's data is as follows:

There are several areas that I would like to highlight for you: the difference in mean return (a reflection of the cycle?); the spread between mean and median (highlighting skew); and most outstanding, the large difference in kurtosis, i.e., the existence of "fat tails"
In order to get a better understanding of the difference in values I plotted the frequency distribution chart for the last 60 months on the same scale as the 1994 one.

So I ask the question that I alluded to in the title of this blog, can the assumptions that used to serve us so well still be relied upon to continue to perform?
Please feel free to request the underlying data for the any of the above charts & tables.
Stay up-to-date with our blog, receive new blog posts by e-mail.


No comments:
Post a Comment