
Between industry conferences and the end of the comment period on GIPS 2010, there seems to be regular and recently increasing discussion and debate about predicted VaR vs. tracking error. Frankly, we believe those comparisons consistently miss two core questions that are essential to your consideration of VaR vs. tracking error.
First, are portfolio returns normally distributed or not?
Tracking error is a standard deviation, and standard deviation elegantly summarizes a normal distribution in a single number. The VaR of a normally distributed series can be easily inferred from the standard deviation. But if the portfolio returns aren’t normally distributed, tracking error doesn’t explain the distribution. That’s just Statistics 101.
When trying to answer whether an equity portfolio’s returns are normally distributed, it is often easiest to first ask whether the portfolio contains equity options. While it is possible that a portfolio containing a diversified set of equity options could still be normal given a long risk horizon, it is extremely unlikely. Realistically, the equity options are in the portfolio to manipulate performance given the manager’s expectation of what will happen. It is our experience that if the portfolio contains equity options, then the returns aren’t normally distributed and therefore VaR is required and tracking error is invalid.
We are aware that one could delta-adjust the option into its underlying equity exposure and then calculate tracking error. Respectfully, this is just wrong. There are few issues in risk analysis as clear-cut as this one.
So, if the portfolio includes no equity options, is it normally distributed? This is a reasonable debate, but an intelligent discussion should center on the second core question that we highlight when working with our clients:
What is the time horizon of the predicted risk analysis?
If you are looking at one day risk, there is general consensus that one day equity returns aren’t normally distributed. Most agree: they are fat-tailed and have negative skew. In practice, you wouldn’t look at the one day tracking error of a portfolio.
Similarly, if your horizon is one year, there is reasonable consensus that equity annual returns are normally distributed. It is reasonable to focus on the tracking error of one year risk for an equity portfolio. Frankly, it would be odd to focus on the one year VaR of a portfolio that only held equities. Tracking error is the more common and appropriate measure of risk.
Our risk model providers, APT, Barra, Northfield, and R-Squared seem to pretty much agree that the minimum period for assuming that equity returns are normally distributed is between two weeks and a month. You may or may not agree, but this should be at the heart of a discussion of VaR vs. tracking error.
But, to come back to you and your needs, what is your risk horizon? If you are a defined-benefit plan sponsor, your horizon is clearly longer than a month and your decision on VaR vs. tracking error should focus on whether the portfolio in question contains non-linear assets. If you are a hedge fund, your horizon is likely less than two weeks, so you should be VaR-centric and focused on how the risk analytics account for fat tails.
My sense is that these two critical points are ignored because they don’t lead to a nice, clean, definitive, and simple answer. Essentially, VaR vs. tracking error depends on what is in the portfolio and your risk horizon.
Subscribe today to receive e-mail updates whenever a new blog is posted.
Friday, June 26, 2009
Thursday, June 18, 2009
Risk Designations and Continuing Education
Almost everyone in the industry is aware that the CFA program offers the opportunity to learn and improve one’s knowledgebase in a broad area of investment topics including quantitative analysis, economics, financial reporting, corporate finance, equity, fixed income, derivatives, alternative investments, ethics, and portfolio management. In fact, there are currently over 82,000 CFA charter holders across the globe who have passed all three levels of the exam.
In recent months, however, I have received many questions from our clients interested in an exam or credential that focuses specifically on risk management, so I’ll weigh in on the topic here.
There are two different organizations which I know of that administer exams focused on risk management. GARP (Global Association of Risk Professionals) offers the Financial Risk Manager exam (FRM) while PRIMIA (Professional Risk Managers’ International Association) offers the Professional Risk Manager exam (PRM). Both are large reputable organizations that bring the community of risk professionals together to promote sound risk management practices globally.
The two exams cover the similar overall topics of market risk, credit risk, operational risk, and investment management risk. The PRM, however, goes much further in depth into the mathematical foundations of risk management including such areas as calculus, matrix algebra, probability theory, and numerical methods.
The FRM, which originally consisted of a single five hour exam given once a year is moving to a two-exam format offered twice a year. The PRM, made up of four 1-2 hour exams, is offered every day at computer testing centers around the world. You can take all four exams in one day or one at a time. One or two levels of the exam are waived if a candidate has achieved certain other designations such as the CFA or Actuarial Fellow.
If interested in tackling another exam, I would suggest looking into the FRM and PRM. Their websites offer candidate guidebooks which provide details to help you determine which one is right for you. There are also blogs out there which discuss the pluses and minuses of each.
Wednesday, June 10, 2009
Decoupling? Really?
I watched with interest last week as John Authers of the Financial Times reported in his Short View video piece that there was real evidence of the emerging markets decoupling from the developed markets. He asserted that the chart of relative performance of the emerging markets relative to the developed markets higlighted how the two markets, encouraged by investment from China, were now operating independently.
Having had little evidence of this decoupling elsewhere I was intrigued by this opinion, so I did a quick check of the performance changes indirections of the two markets. Using the same methodology as in my previous blog, I looked at the rolling 60 day correlation of MSCI Emerging Markets with MSCI The World.
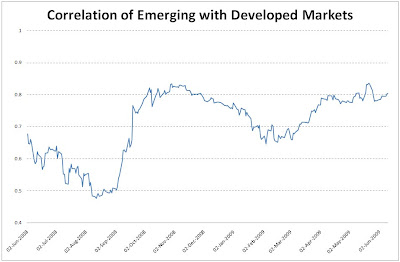
This chart would suggest that decoupling is one thing that is definitely not happening. Over the period of the chart, we see how from early June 2008 through August the two equity markets were moving less and less in step as the perception of trouble was that it was all Developed in nature focused on the Financial Sector. As realization dawned in September that the trouble was much less constained and much more endemic, we saw the correlation rise, peaking at the end of October when the geographical nature of equity was considered irrelevant.
A steady decrease in correlation through the end of February reflects investors gaining further insight into any quality of earnings, levels of exposure, etc. from when the "rally" has lead to massively increased correlations, back to near-October levels.
I do see what John is looking to highlight in his article -- the continuing outperformance of emerging markets on a relative basis -- but I do not think that this due to decoupling of the markets. This data suggests that the call continues to be whether one should be in equities at all, not whether they should be in developed or emerging.
To receive future posts by e-mail, subscribe to this blog.
Having had little evidence of this decoupling elsewhere I was intrigued by this opinion, so I did a quick check of the performance changes indirections of the two markets. Using the same methodology as in my previous blog, I looked at the rolling 60 day correlation of MSCI Emerging Markets with MSCI The World.
This chart would suggest that decoupling is one thing that is definitely not happening. Over the period of the chart, we see how from early June 2008 through August the two equity markets were moving less and less in step as the perception of trouble was that it was all Developed in nature focused on the Financial Sector. As realization dawned in September that the trouble was much less constained and much more endemic, we saw the correlation rise, peaking at the end of October when the geographical nature of equity was considered irrelevant.
A steady decrease in correlation through the end of February reflects investors gaining further insight into any quality of earnings, levels of exposure, etc. from when the "rally" has lead to massively increased correlations, back to near-October levels.
I do see what John is looking to highlight in his article -- the continuing outperformance of emerging markets on a relative basis -- but I do not think that this due to decoupling of the markets. This data suggests that the call continues to be whether one should be in equities at all, not whether they should be in developed or emerging.
To receive future posts by e-mail, subscribe to this blog.
Monday, June 1, 2009
Do as we say, not as we do!
Now with a title like that I could be commenting on the British Parliamentary system and potentially expand upon some of the greatest hypocrisy ever seen, but this week I wanted instead to look at the recent "recovery," and try to see through some of the words and commentary beling generated by managers either encouraging us all back into the market with "the recovery well underway" or telling us this is all implausible and there is a sucker punch around the corner.
Opportunity risk is something that everyone is aware of, and the recent 34% rise in the S&P 500 further underlines the old adage of "not timing the market but time in the market." Anyone slow to react has seen a real opportunity go by (the rally has been even larger for certain sectors, e.g., Financials up 100%), and the question following such returns has to be whether this is just a reaction to over-pessimism before a period of sideways movement, the beginning of a sustained upwards trend, or as many economists are warning, a false dawn with unemployment still rising and severely denting any hopes of an early return to growth.
In order to get a general feel I have looked at the cash allocation of those funds in the Lipper U.S. Equity Large Cap Universe. This universe is large enough for a general analysis and I am using cash allocation as a proxy for confidence in the recovery, paralleling an increase in allocation with doubt about the rally and vice versa. I believe that cash allocation should be an active decision, and so in order to exclude those funds whose cash holding mandated limits might add noise, I have excluded any fund with less than a 4% cash allocation.
The chart above follows the average cash allocation of the fund universe against the level of the S&P 500 from early 2006 until today. We see that it has been steadily rising through mid-2007 despite a slightly rising market, reflecting the move towards a more defensive stance. The rapid market falls also shows, not surprisingly, a surge in cash allocation as managers opted out of the market altogether.
Interestingly, the recent rally reflects some money returning to equities but still less than the end of last year, underlining, I believe, the cautious nature of this rally and the belief that there may well be more trouble to come.
Does your allocation reflect your belief?
To receive future posts by e-mail, subscribe to this blog.
Subscribe to:
Posts (Atom)


