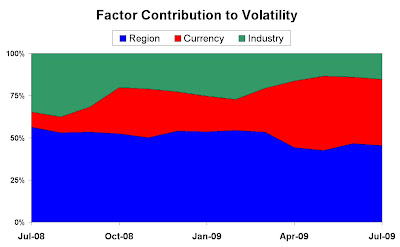
Much of this blog discusses portfolio risk from the perspective of exposures to market factors and measurements like VaR and tracking error. Though much is debated about their methodology and applicability, most portfolio managers monitor these risk measurements on a regular basis and use them as they see fit. I think most would agree that risk is not something we can encompass into a single number; in risk management, more is better.
Most stock scoring models I encounter are variations of a common construct: combine fundamental factors with momentum factors to generate a multi-factor score. In the continual search for alpha with low risk, a practitioner may want to consider an accounting and corporate governance factor. This often overlooked factor can have the double-impact of raising alpha while lowering portfolio risk.
In this study, I use Audit Integrity’s Accounting and Governance Risk (AGR) Score. In brief, the AGR score measures the accounting and corporate governance profile for North American and Western European stocks: companies with low scores have a higher risk of potentially fraudulent or misleading activity. This type of measurement is traditionally not measured in commercial risk models or is not easily calculated by an analyst.
In a factor test of the Russell 3000, from 12/31/2000 to 6/30/2009, the AGR factor had a statistically significant 12-month information coefficient (IC) of 0.0578. When filtered down to the bottom size quintile, the IC jumps to a significant 0.088. You could look at the AGR data across other cross sections – sectors, valuation bins, etc – and find that the score’s efficacy persists.
The potential for higher alpha portfolios is highlighted in the simulations I run below. Simulations A and B are optimized portfolios* where A uses a short term multi-factor score and B uses the Accounting and Governance Risk Score as the stock scoring measurement.
 The results show simulation B having a higher alpha, lower beta, and higher overall IR. Also note the standard deviation of portfolio returns is lower when using the AGR score (i.e., less portfolio risk).
Another practical application of incorporating the AGR score is to see how the AGR can affect a multi-factor stock scoring model. The table below shows the results of portfolios an optimized portfolio using a multi-factor stock score model without (C) and with (D) the AGR incorporated in the score.

Here, despite the higher overall portfolio risk (stdev of portfolio returns), the IR is higher for the multi-factor model that includes the AGR component.
A final example I will walk through is how you can use the AGR as a stop-loss mechanism. The portfolios below were constructed using a trade-rules based simulation†. Portfolio F uses a stop-loss mechanism that sells out of positions that have fallen below acceptable AGR standards.

By using the AGR as a stop-loss mechanism, we are able to turn this negative alpha portfolio (E) into a slightly positive alpha portfolio (F). By keeping a watch on positions with respect to their accounting and risk governance rating, we are able to improve portfolio performance and reduce risk.
The simulations show there are a variety of ways to incorporate this factor into the management of the portfolio. You can gain additional insight by running performance attribution across the AGR groups to see how “very aggressive” companies contribute to your portfolio’s return. In short, adding this alternative risk measurement factor to your analysis can both diversify your stock scoring models and subsequently enhance portfolio returns.
Guest blogger Sammy Choo is Vice President of Quantitative Analytics at FactSet.
*Portfolios A, B, C and D are optimized portfolios with the following constraints:
Asset Min: Max(0,Bench Weight-.5%)
Asset Max: 1.5 x Bench Weight
Sectors: +/- 2% Bench Weight
Expected Returns: Short Term Alpha Score or AGR Score
†Portfolios E and F have the same parameters as A-D, except a rules-based engine is used and stock ranks are Short Term Alphas or AGR Score.
To receive future posts by e-mail, subscribe to this blog.


 The results show simulation B having a higher alpha, lower beta, and higher overall IR. Also note the standard deviation of portfolio returns is lower when using the AGR score (i.e., less portfolio risk).


 The overweighting of the S&P500 in Information Technology would have a negative relative effect with the strong Dollar affecting the returns of large exporters such as IBM, Apple, Microsoft, etc. The relative underweighting of the S&P 500 in Financial stocks (e.g., 14.9% vs FTSE 100 >21%) where through globalisation most have a large exposure to the U.S. (e.g., HSBC and Barclays), would generate a positive return, as would the Materials sector where the low exposure to commodities (all priced in USD) is a boon (i.e., no exposure to BHP Billiton, Rio Tinto, etc.)


