Tuesday, January 27, 2009

Are current portfolio construction techniques hampering managers from following their ideas with conviction?

When constructing portfolios in times of increased volatility, do managers have less conviction in their outlook, or is it a case of the risk analysis "tail" wagging the portfolio construction "dog"?

Any portfolio manager constructing a fund using an existing risk-aware framework will see that his active positions will be smaller than historically and that his portfolios are much closer aligned with their benchmarks. To prevent drift from those benchmarks there will be increased turnover in smaller positions, which in turn leads to an increase in transaction costs. What is causing this change in behaviour with its subsequent "performance drag"?

The answer is a marked increase in volatility. The turmoil in the markets over the last 18 months or so has led to a huge increase in the volatility of the world’s equity markets as highlighted below in the current levels of the VIX. We see that despite today’s value well below October’s highs we are still at levels last experienced in the market lows of September 2002, about double the normal levels.


So how does increased volatility feed through to portfolio construction? Let’s consider this from the reverse angle, using Implied Alpha. In a portfolio, a stock’s Implied Alpha is the required expected outperformance of that stock for the existing portfolio to be considered optimal. It specifically quantifies the magnitude of a more general conviction that may be apparent through an under/overweight. The general definition is:
Assuming that a manager is constant in his appetite for risk and that his mandate has not changed in terms of permitted active bets etc., then we can see that a jump in portfolio risk brings a corresponding jump in implied alpha. In other words, a manager taking an active position similar in magnitude to a year ago has an implied conviction of much higher outperformance. Consider this the other way round: In January 2008, a 3% overweight in Exxon vs SP500 had an implied alpha of 35bps, but the same alpha today would only require a 1.7% overweight.

What do you think? Is the tail wagging the dog? Share your opinions below.

Get updates to this blog delivered to your inbox.

Wednesday, January 14, 2009

Getting through the land of VaR confusion

Why are so many people lost in VaR? To start, consider this statement: “Because an agricultural propeller airplane cannot cross the ocean, cross-continental airplane travel is impossible.” The absurdity of it is quite obvious. All agricultural prop planes are airplanes, but not all airplanes are agricultural prop planes. Yet, an equivalent statement is either made or implied in the risk measurement area with surprising frequency. Parametric VaR is a type of VaR that cannot deal with tail events, but not all types of VaR are Parametric.

A good example is the feature in the New York Times Magazine, which Rick referred to in his previous post. It is not every day that the Times goes in-depth on VaR, so I think it is worth discussing in a bit more detail. Firstly, this work is way above the average level of the financial journalism. The author really tried to understand the issues involved, get differing opinions and come to some conclusions. The fact that the article is quite confused about VaR is not the author’s problem; it is a reflection of the confusion that unfortunately exists even among the professionals in the industry.

The article does start with the crucial distinction between the types of VaR:
“VaR isn’t one model but rather a group of related models that share a mathematical framework. In its most common form, it measures the boundaries of risk in a portfolio over short durations, assuming a ‘normal’ market.”
That right there should stop the readers. What is a “normal” market? How do the words “normal” and “risk” end up in the same sentence? Who would want a risk tool that only works when you don’t need it? All these points are later made by the interviewees. But, they should have started with the definition. If VaR is only valid in “normal” conditions, what possible problem could they have with it not capturing the tail events, if it was right there in the definition?

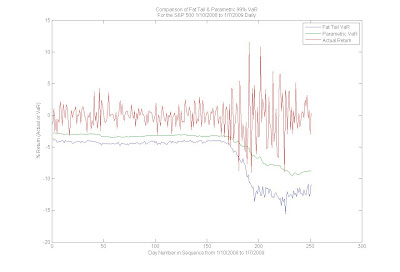
The truth is, Parametric VaR, which is the method that the definition above refers to, is not useful for estimating anything but the standard deviation of the short-term (i.e., daily or weekly) returns. It can never ever be used to estimate 99% VaR on the daily frequency, and yet it is used for that by far too many people. But Parametric VaR is not the only type of VaR. Monte Carlo VaR does not suffer from the crippling “normal” conditions requirement. In fact, it can allow for many distributions with fat tail effects that fit the actual short-term returns much better. A great example is the Student’s T distribution, which FactSet uses in the short-term MC VaR numbers in our Portfolio Analysis application. I think the following chart should clarify the confusion between the two types of VaR with regard to tail events:

In the chart, we see the actual returns (in red) of the S&P 500 over the period from 1/10/2008 to 1/7/2009. We also see the Parametric VaR (green) and Fat Tail VaR (blue) that is based on the Student’s T distribution. Both are based on the same advanced multi-factor model, so they are identical in all respects except the distributional assumption.

After considering the chart, it becomes quite obvious what the “normal” conditions caveat tells us. Parametric VaR has nothing to do with tail events. 99% VaR should be breached about 1% of the time on average by its very definition. Parametric 99% VaR was broken 10 times over the 250-day period, which basically means that it can never be used to estimate the 99% VaR. Fat Tail Monte Carlo VaR, on the other hand, was only broken twice, which is equal to what the ideal model would have produced over this period.

Conclusion: Not all VaR is Parametric VaR. Do not estimate the 99% VaR with the Parametric VaR and use only the Monte Carlo Fat Tail VaR for that purpose. Parametric VaR is for “normal” conditions only, just as the definition tells us.

Get updates to this blog delivered to your inbox.
Friday, January 9, 2009

Did reliance on VaR contribute to the current economic crisis?

I am sure many people read the Risk Management cover story written by Joe Nocera featured in this week’s New York Times Magazine. The article provides some background on Value-at-Risk, and discusses whether proper use of it could have helped prevent the current financial crisis or whether reliance on it helped cause the crisis. There have been many discussions on the article already including Barry Ritholtz’s blog.

Many people interviewed expressed greatly differing views, some of whom had incredibly strong feelings on the subject. Nassim Taleb and David Einhorn had similar comments and believe that VaR is more or less a useless fraud. Taleb continues to refuse to even talk about the subject. Einhorn says “VaR is like an airbag that works all the time except when you have a car accident.” I think it’s important to understand that VaR is just one tool used in risk management. You shouldn’t rely on an airbag as your sole means of protection in case of a crash. Just as you should still wear your seat belt and have anti-lock brakes and other safety features in your car, you should also use other tools aside from VaR to manage portfolio risk. You must also use the tools correctly.

Nocera includes the caveat “assuming a normal market” in his definition of VaR on the first page. I believe that caveat is part of the problem and contributes to why many frown on and even attack VaR. I have seen numerous firms simply delta adjust their option positions when calculating VaR. This leads to highly inaccurate measures since that approximation breaks down completely when you need it most – in the 1% tail.

A good risk system and VaR measure must use Monte Carlo simulations with appropriate option pricing models to calculate VaR. There is no simple closed-form solution. It must also take account of the fat-tailed nature of the short-term returns of equities and other primary assets. Other points to consider are to make sure to use appropriate risk models for the time period being measured, perform stress testing on your risk system, compare risk to your P&L, and look at trends in all of the above. Looking at a single VaR number on its own is not an appropriate risk management practice.

Do you agree with Taleb or do you think VaR has a place in risk management if used properly? Share your thoughts below.

Get updates to this blog delivered to your inbox.

Tuesday, January 6, 2009

About This Blog

Welcome to FactSet's Taking Risk blog!

FactSet has been a leading provider of financial information and analytic applications for investment professionals around the globe for the past 30 years. We offer instant access to data and analytics to thousands of analysts, portfolio managers, and investment bankers at the world’s premier financial institutions.

For the past nine years, we have leveraged our portfolios analytics capabilities to build a strong risk business that serves the needs of hundreds of our clients. We have partnered with some of the leading risk providers in the world, including Northfield, Barra, APT, Axioma, and R-Squared. Clients rely on us for optimization, backtesting, risk decomposition, and risk based performance attribution. We use Monte Carlo techniques to properly account for the risk associated with derivatives and fat tails and offer stress testing packages to uncover how shocks to different factors will impact the performance of a portfolio.

This blog's authors - the management and senior developers of FactSet’s risk group - have an average of 15 years of industry experience. We will use this blog to generate discussions on current topics in the risk field and welcome your comments and ideas.

Get updates to this blog delivered to your inbox.