A good example is the feature in the New York Times Magazine, which Rick referred to in his previous post. It is not every day that the Times goes in-depth on VaR, so I think it is worth discussing in a bit more detail. Firstly, this work is way above the average level of the financial journalism. The author really tried to understand the issues involved, get differing opinions and come to some conclusions. The fact that the article is quite confused about VaR is not the author’s problem; it is a reflection of the confusion that unfortunately exists even among the professionals in the industry.
The article does start with the crucial distinction between the types of VaR:
“VaR isn’t one model but rather a group of related models that share a mathematical framework. In its most common form, it measures the boundaries of risk in a portfolio over short durations, assuming a ‘normal’ market.”That right there should stop the readers. What is a “normal” market? How do the words “normal” and “risk” end up in the same sentence? Who would want a risk tool that only works when you don’t need it? All these points are later made by the interviewees. But, they should have started with the definition. If VaR is only valid in “normal” conditions, what possible problem could they have with it not capturing the tail events, if it was right there in the definition?
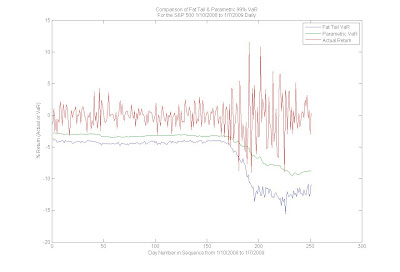
The truth is, Parametric VaR, which is the method that the definition above refers to, is not useful for estimating anything but the standard deviation of the short-term (i.e., daily or weekly) returns. It can never ever be used to estimate 99% VaR on the daily frequency, and yet it is used for that by far too many people. But Parametric VaR is not the only type of VaR. Monte Carlo VaR does not suffer from the crippling “normal” conditions requirement. In fact, it can allow for many distributions with fat tail effects that fit the actual short-term returns much better. A great example is the Student’s T distribution, which FactSet uses in the short-term MC VaR numbers in our Portfolio Analysis application. I think the following chart should clarify the confusion between the two types of VaR with regard to tail events:

In the chart, we see the actual returns (in red) of the S&P 500 over the period from 1/10/2008 to 1/7/2009. We also see the Parametric VaR (green) and Fat Tail VaR (blue) that is based on the Student’s T distribution. Both are based on the same advanced multi-factor model, so they are identical in all respects except the distributional assumption.
After considering the chart, it becomes quite obvious what the “normal” conditions caveat tells us. Parametric VaR has nothing to do with tail events. 99% VaR should be breached about 1% of the time on average by its very definition. Parametric 99% VaR was broken 10 times over the 250-day period, which basically means that it can never be used to estimate the 99% VaR. Fat Tail Monte Carlo VaR, on the other hand, was only broken twice, which is equal to what the ideal model would have produced over this period.
Conclusion: Not all VaR is Parametric VaR. Do not estimate the 99% VaR with the Parametric VaR and use only the Monte Carlo Fat Tail VaR for that purpose. Parametric VaR is for “normal” conditions only, just as the definition tells us.
Get updates to this blog delivered to your inbox.


How would one go about recreating the MC VaR vs S&P actual returns chart? Is the chart published on FactSet platform?
ReplyDeleteWe create the charts in either Excel or a stats package using data from Portfolio Analysis. To create the chart for a portfolio you manage, you can bring back the daily portfolio returns in PA along with the Monte Carlo VaR and parametric VaR each day. For a benchmark, such as the S&P 500, you can gather the actual published returns from the Security Prices app or by using a downloading code in Excel.
ReplyDelete