Thursday, May 21, 2009

Does your portfolio have multiple personalities?

The term "risk analysis" is myriad in nature, covering multiple asset classes, multiple methodologies for calculation, referring to ex-post or ex-ante in nature, etc. The manner in which risk analysis is embraced by practitioners is also multi-faceted; some firms use it in a purely monitoring mode, others as a tool to guide investment policy, and yet others as a check and balance for fund composition. The one constant in all this is the desire to get an understanding of the sources of portfolio risk, how fund construction has blended many and varied individual characteristics into one profile with sensitivities to the changing factors.

These sensitivities are often a reflection of conviction for the future, overweight/overexpose those areas that you believe will outperform and vice versa.

A further critical by-product of this analysis is to highlight sensitivites to areas that are in contradiction of those beliefs, or even where an opinion might not be held, but exposure is significant. Some of these risks may be inherent in the nature of the investment. For example, it is very difficult to invest in an energy supplier without taking on an exposure to a market cap based factor such as size. Even so, while it may not be possible to diversify these risks, it is imperative that we are aware of them, so identification is important. This is an area where risk model definition should be picked to suit the preferences of the manager.

To highlight this, I looked at an emerging market country, South Korea, and what its major risk drivers are now. (For this analysis I have selected the R-Squared risk model but this can just as easily be done with any of the risk models carried by FactSet.)

The three main drivers of risk according to the model are: Emerging Asia, Electronic Technology, and the Euro.

The global nature of the model with its regional classification explains the first factor, and with >22% by weight in the Electronic Technology Sector (FactSet definition) one would expect a large sensitivity to movements there. The factor that does stand out however, is the forecast risk coming from an exposure to the Euro. This is Korea!

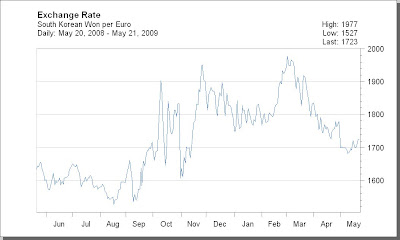
Let's drill down a little further and see the individual stock names that supposedly contribute to this exposure: Samsung Electronics and LG Electronics combine to about 20% by market cap. Samsung and LG Electronics both sell a huge amount of their products into Europe -- 45% & 22% respectively as of their last reported financials. Look at the chart below of the movement in the exchange rate for SKW/EUR and suddenly the potential impact of this exposure makes sense.

Anyone investing in Samsung is aware of this. I am not highlighting anything new here but merely trying to show how potential "torpedoes" can be identified.

How do you find out where all your risks are?

Get new Taking Risk entries delivered to your e-mail as they are posted.

Wednesday, May 13, 2009

Were the bank stress tests stressful enough?

Last week, federal regulators released the long awaited results of the stress tests of the 19 largest US banks. After months of testing, it was determined that 10 of the 19 banks need to raise an additional $75 billion in total capital to withstand future losses should the recession deepen. Two scenarios were run based upon rising unemployment and falling housing prices. Under the more adverse of the two scenarios, regulators estimated losses at each bank resulting from a scenario in which unemployment hits 10.3% and housing prices fall 22%. Many argue that this scenario is not severe enough as unemployment is expected to hit 10% by year-end, just shy of the most severe stress test. The good news is that the banks are working to raise the capital through stock offerings and asset sales such that very little new taxpayer bailout money is expected to be needed.

I decided to see how the government’s stress test results of the banks’ capital structures matched up against a stress test of stock performance using the same stress factors and stress amounts, but in a multi-factor risk model framework. I created a portfolio of the 19 stocks and applied the worst case government scenario to evaluate the potential impact on the stock returns of these 19 banks. I ran the stress test as of February to be comparable to the published stress tests. I used the R-Squared Global Equity Risk model in the analysis.

The report lists the capital needs, market capitalization, and capital needs as a percent of market cap for the 19 banks. The last three columns show the predicted impact on stock performance given a scenario of unemployment rising to 10.3%, housing prices dropping 22% as measured by the S&P/Case Shiller Housing Index, and a third scenario which combines the first two. This third scenario is comparable to the stress tests performed by regulators. Of the nine banks the Fed determined not to be in need of additional capital, seven are at the top of the performance list based upon this stress test. The bottom six performers under my stress test are the banks most in need of capital as measured by percent of market cap. Note that the stock performance of GMAC is hard to account for since it is a unit of GM.


So the government’s stress test of capital needs and this stress test of stock performance are actually very much in line. Whether the unemployment and housing price scenarios used in the stress tests were severe enough is another question.